Broadening the Toolbox with GP-Centered Secondaries

Welcome to Up Close with Carlyle, where we look at the investment landscape from a different point of view. In each edition, we share insights from executives across our firm. Subscribe here to be notified of future editions.
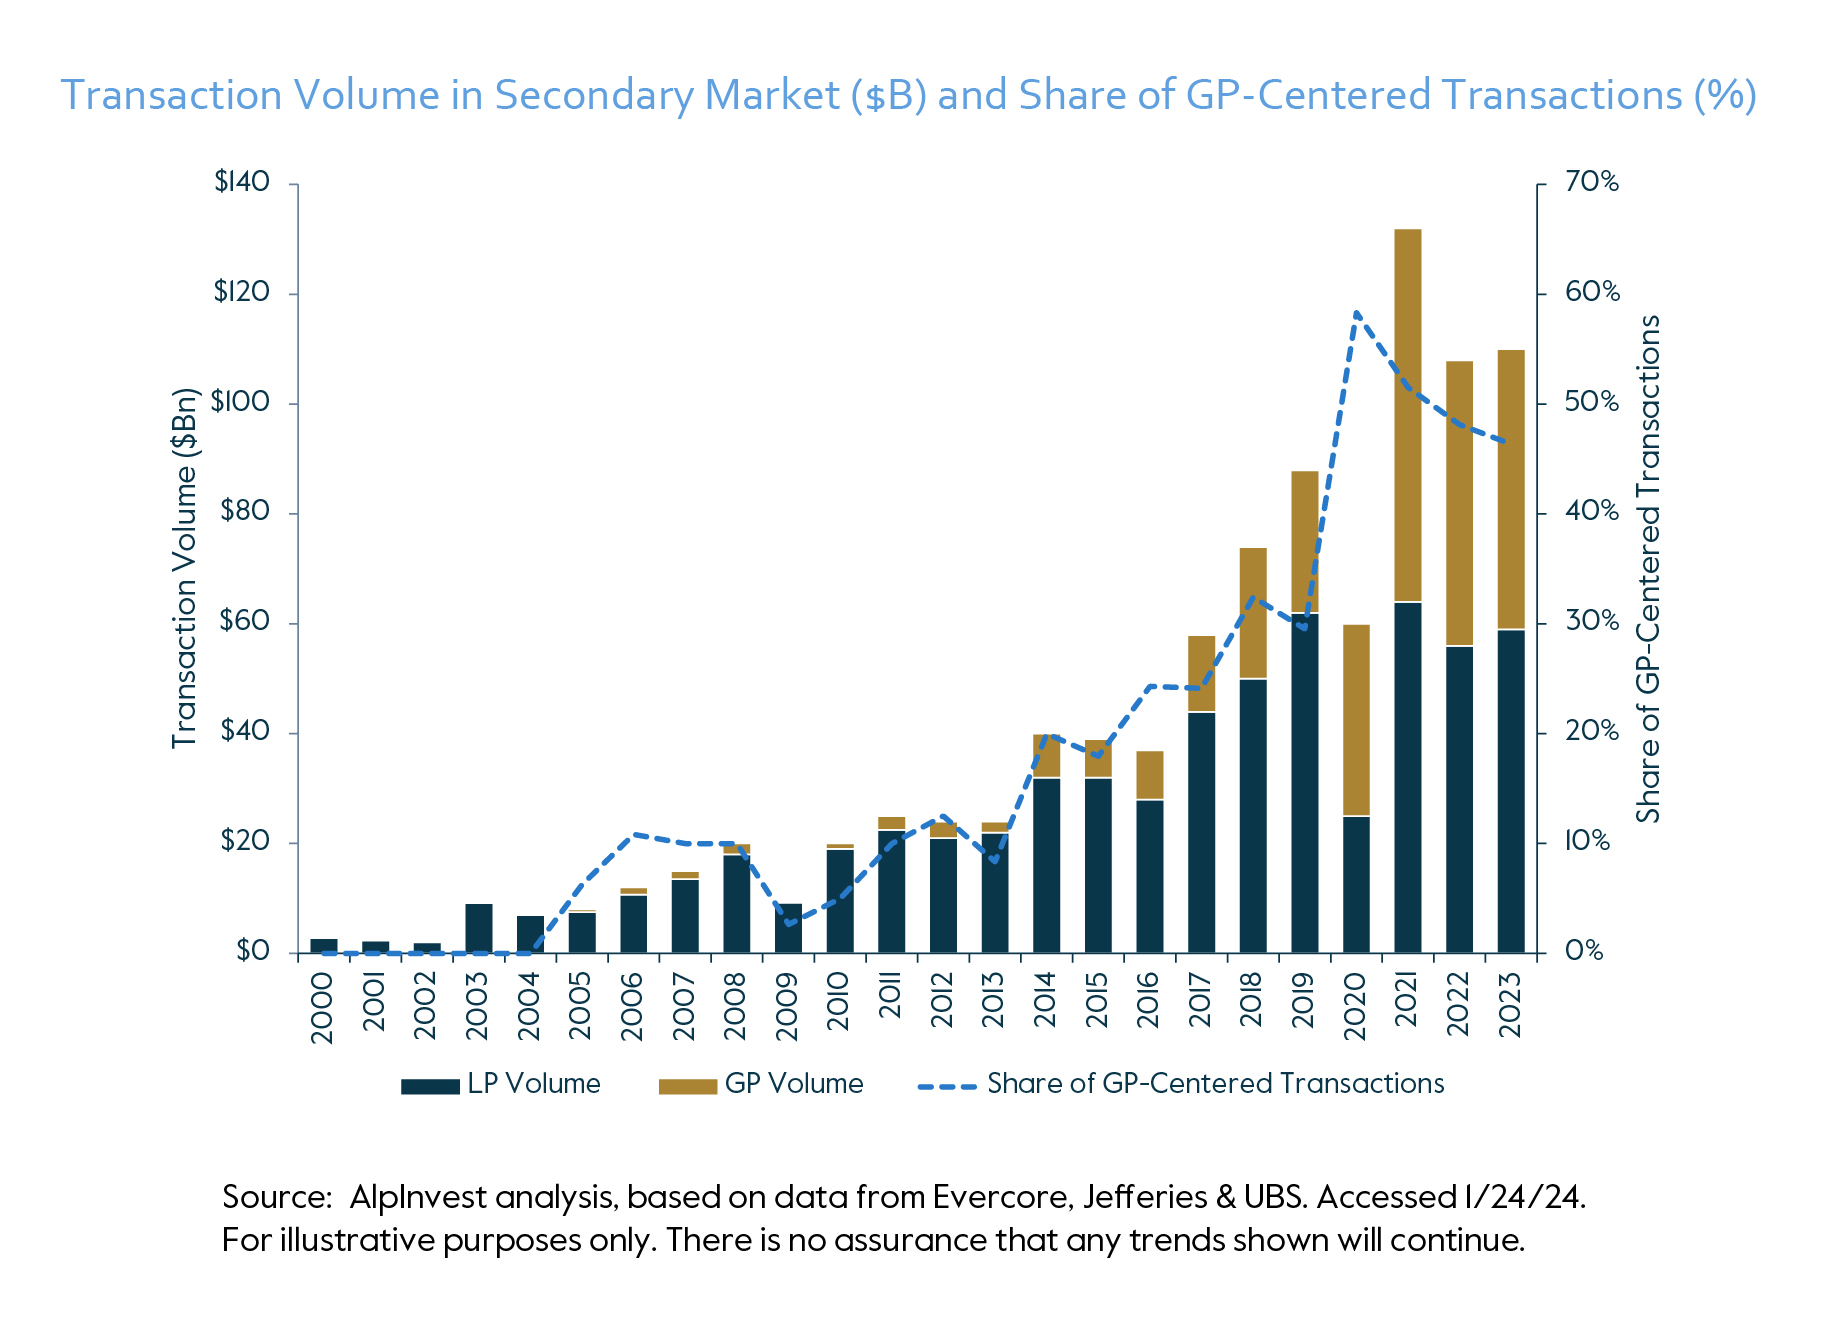
Investors in the secondary market have seen substantial growth over the past decade. By our calculations here at AlpInvest Partners, we’ve seen roughly 2X market growth every four to five years, starting with average volume around $24 billion from 2011 to 2013, up to roughly $100 billion in average volume from 2019 to 2023[1].
Today, we see a number of market themes at play: market dislocation is reducing traditional liquidity, driving increased needs for secondary solutions; the supply of transactions has outpaced capital formation since 2020; a large increase in overall private equity exposure supports continued volume increases; and increased adoption of General Partner (GP)-led solutions.
Historically speaking, transaction volume in the secondary market has been driven by Limited Partner (LP) volume. However, the GP-centered secondary market has seen explosive growth since the mid-2010s, rivalling the turnover in the traditional LP-interest part of the market. Initially providing liquidity solutions by recapitalizing tail-end funds with troubled assets, GP-centered secondaries have morphed into an instrument that helps GPs manage duration mismatches and optimize value creation of single trophy assets. Today, GP-centered transactions account for approximately 50% of the total turnover of the global secondary market.
In essence, GP-centered secondaries broaden the toolbox for sponsors in a market where traditional fund structures have remained remarkably rigid. While standard private equity fund structures that were designed in the 1970s generally constrain the holding period of portfolio companies to around five years, there may be situations where a longer holding period allows firms to generate the full value potential of an asset. In those cases, continuation funds, the most common form of GP-centered transactions, may provide efficient solutions.
Additionally, private equity has increased its emphasis on active management, creating greater needs for follow-on capital years after an initial investment. In turn, these needs may require new sources of liquidity not need during the original private fund structure.
Having alternative liquidity strategies at one’s disposal doesn’t just help GPs. They can also be beneficial for LPs who may face constraints and seek to rebalance their private equity exposure.
GP-centered transactions and traditional LP-interest secondaries both involve purchasing exposure in the same underlying private funds. However, the two market segments differ substantially in terms of their complexity and deal technology.
Initiated by a sponsor rather than an LP, the current form of GP-centered transactions evolved in the mid-2010s. In many ways, the spinouts of captive teams, typically from large financial institutions in the 2000s, were an important predecessor of today’s GP-centered transactions. A major catalyst was the Global Financial Crisis (GFC), which caused traditional exit routes—trade sales to strategic buyers, secondary buyouts and initial public offerings (IPOs)—to become substantially clogged. With fundraising drying up amid a profound dearth of distributions, GPs started to explore liquidity solutions via secondary transactions.
While the GP-centered secondary market emerged in earnest in the aftermath of the GFC, initially the volume of these transactions remained muted as sponsors’ efforts were frequently perceived to involve troubled funds whose assets were difficult to sell for various reasons. For the most part, the transactions that materialized during this period were tail-end fund restructurings. Thus, global volume (excluding spinouts of captive private equity platforms from bank balance sheets) averaged only $1.5 billion in 2011-2013, or approximately 6% of the total turnover in the secondaries market[2].
However, as an increasing number of brand-name managers discovered the potential benefits of secondaries as a portfolio management tool, awareness and acceptance started to rise in the investor community. New forms of GP-centered secondaries emerged, with fund-level recapitalizations of younger and higher quality funds emerging around 2014 to 2015 and the first continuation funds being formed by 2017. Usually involving multiple assets, continuation funds rapidly gained market share, enabling GPs to extend asset duration; raise growth capital; and generate liquidity for their LPs.
This new more targeted continuation fund almost entirely displaced annex funds and strip sales as well as a significant portion of fund recaps. By the end of the decade, GP-centered transactions had increased to $26 billion, representing a market share of almost 30% (Figure 1).
We at AlpInvest believe that proper alignment of interests between GPs and LPs is a key area of focus with investors, and have seen a significant percentage of LPs embracing the liquidity created by GP-centered secondaries when provided the option.
To learn more about our findings in this space, I encourage you to request a copy of our full report by emailing info@alpinvest.com or submitting an inquiry form here.
Part of Carlyle’s Global Investment Solutions, the Secondary and Portfolio Finance Team at AlpInvest has utilized the secondary market to build differentiated private equity portfolios for more than twenty years, driven by high quality relationships with general partners.
[1] For illustrative purposes only. No assurance that trends depicted will continue. Secondary market volume amounts and composition are AlpInvest estimates for Private Equity secondary volume (excluding real estate and infrastructure) based on (i) AlpInvest deal flow figures, (ii) publicly available news sources (including www.SecondariesInvestor.com and Preqin) and (iii) market data provided from 2016- July 2023 to AlpInvest by select large secondary market intermediaries which has been aggregated using AlpInvest estimates for relative market share. Estimates and projections are based on various assumptions. Actual results may vary substantially.
[2] Jefferies, Global Secondary Markets Review, various issues.